Sentinel is not a black box: operations are continuously instrumented, with the same tools your own technical team would use.
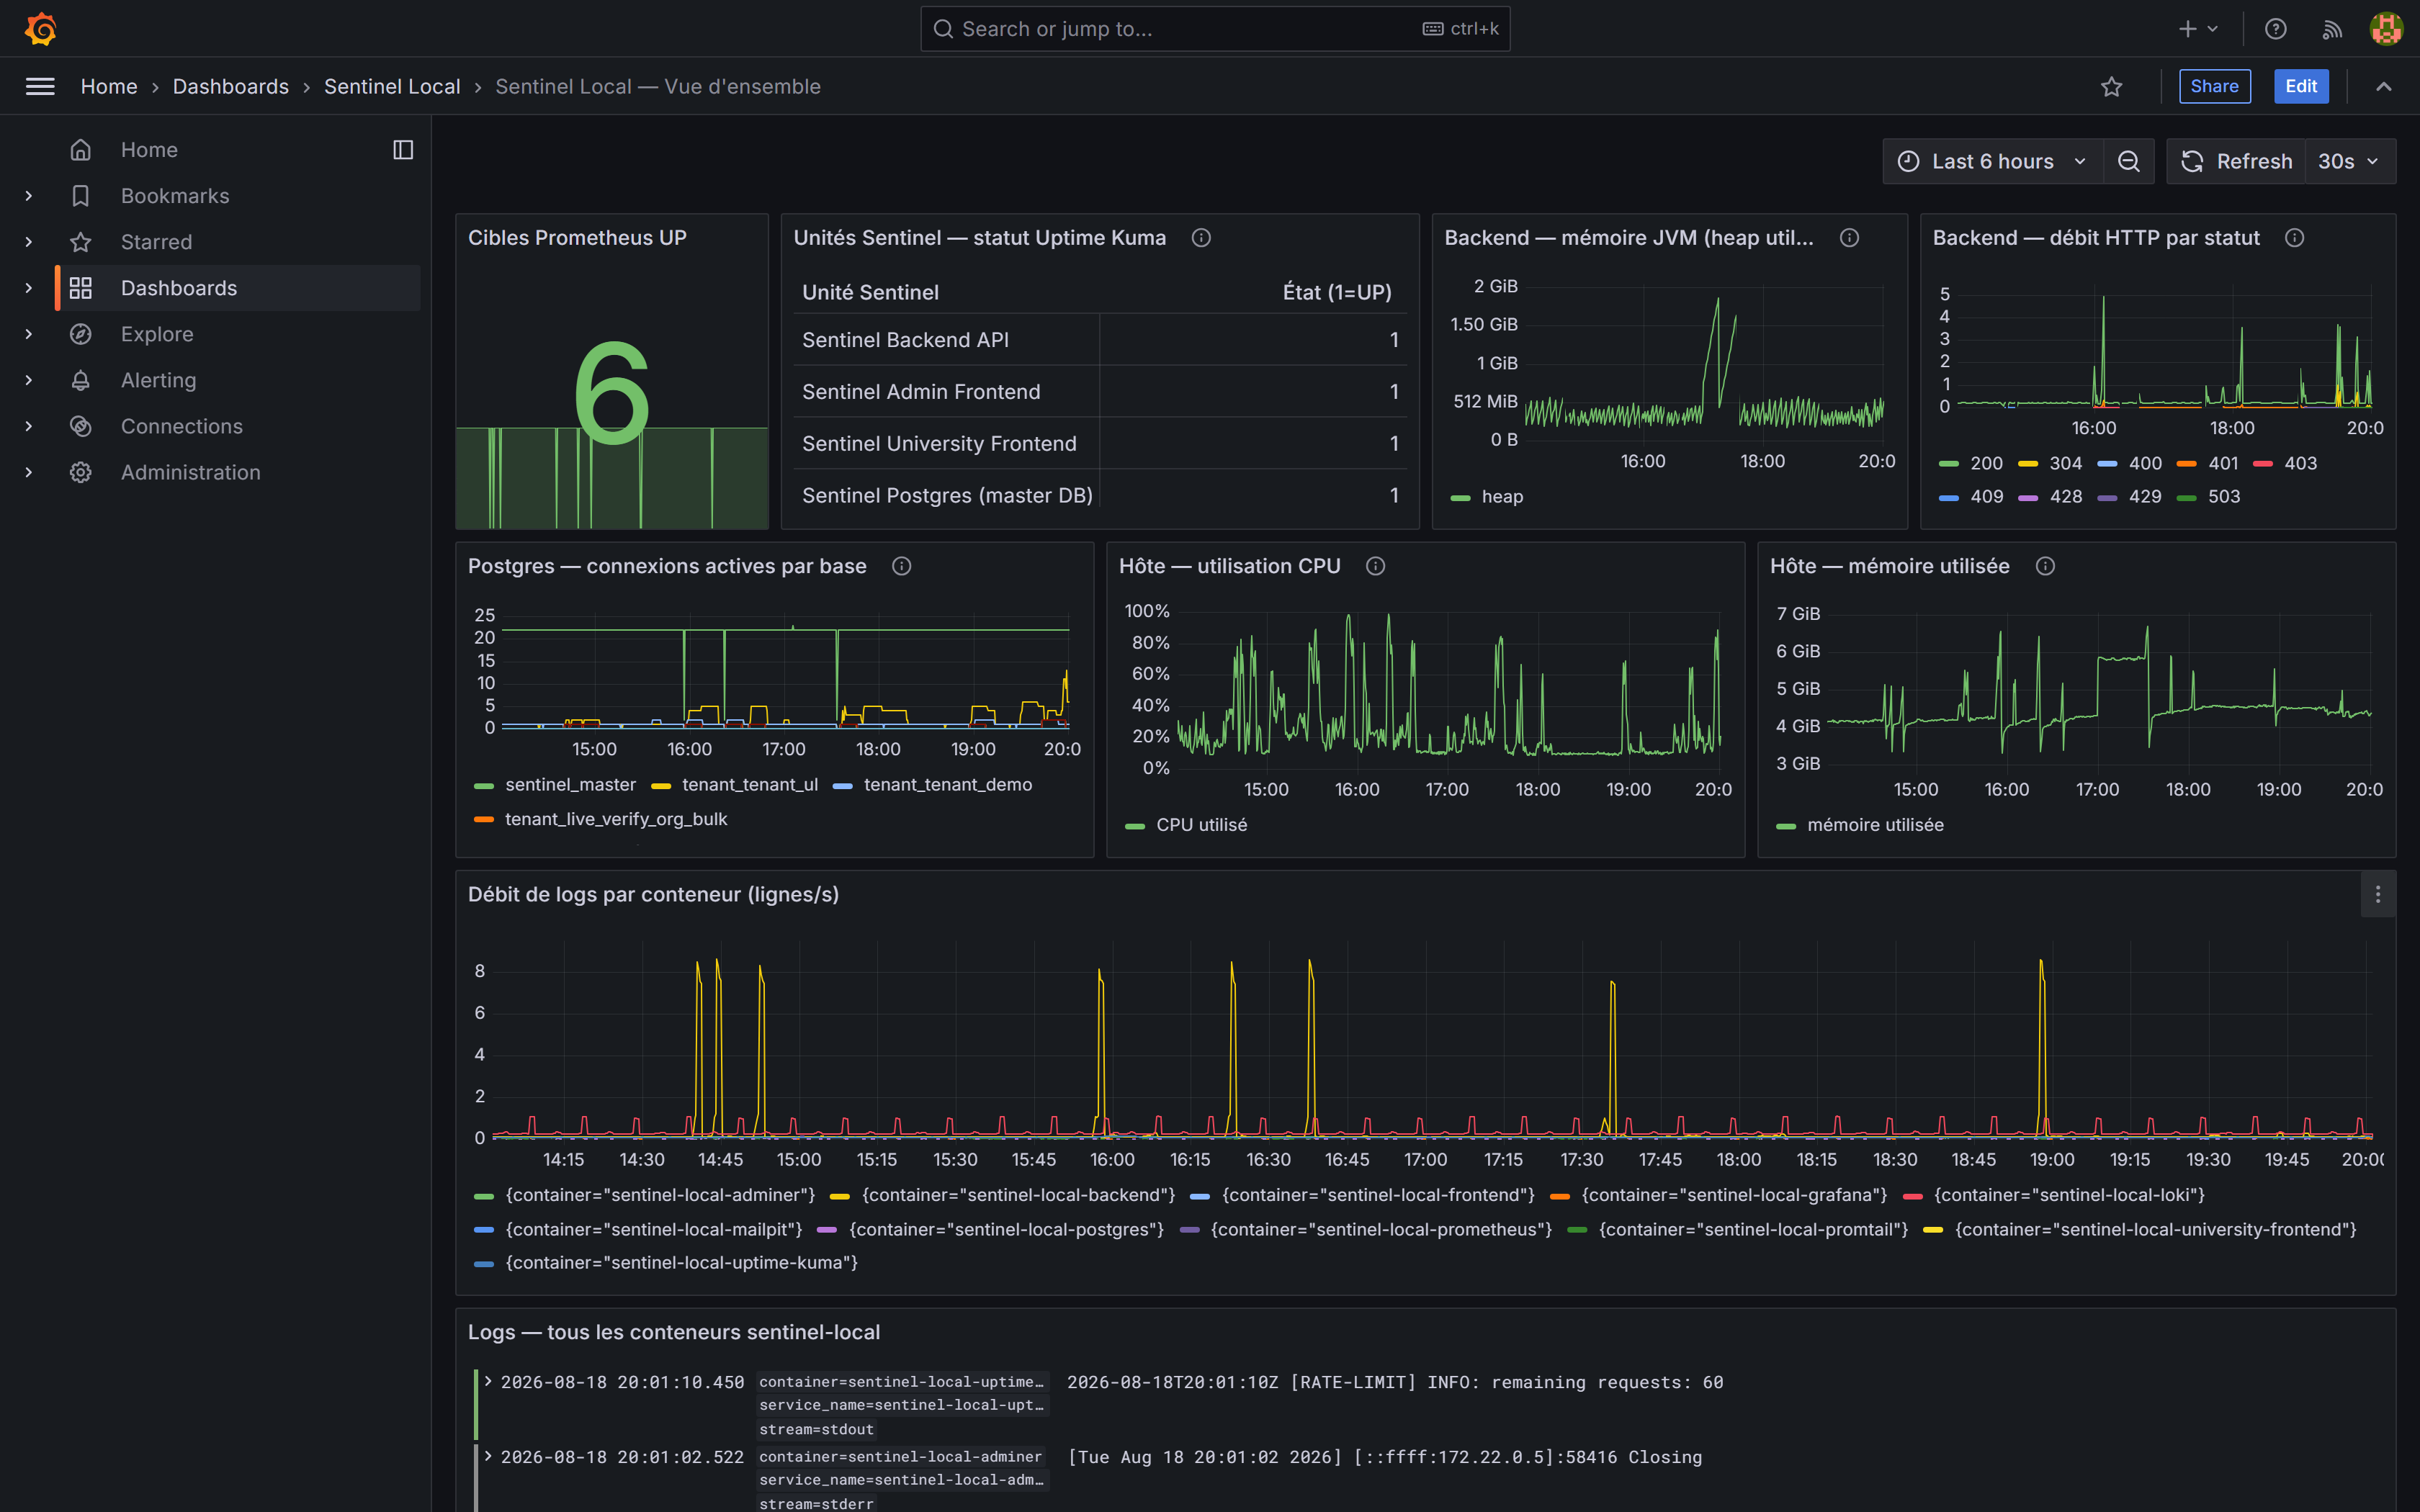
Grafana -- real-time overview: JVM memory, HTTP throughput by status, Postgres connections per tenant, CPU, log throughput per container.
A real-time overview
The "Overview" dashboard aggregates the metrics that actually matter in operations: application JVM memory, HTTP throughput by status code, active connections per tenant database, host CPU and memory usage, log throughput per container.
- JVM memory, HTTP throughput by status, Postgres connections per tenant
- Host CPU and memory usage, live
- Logs from every container, centralised and searchable
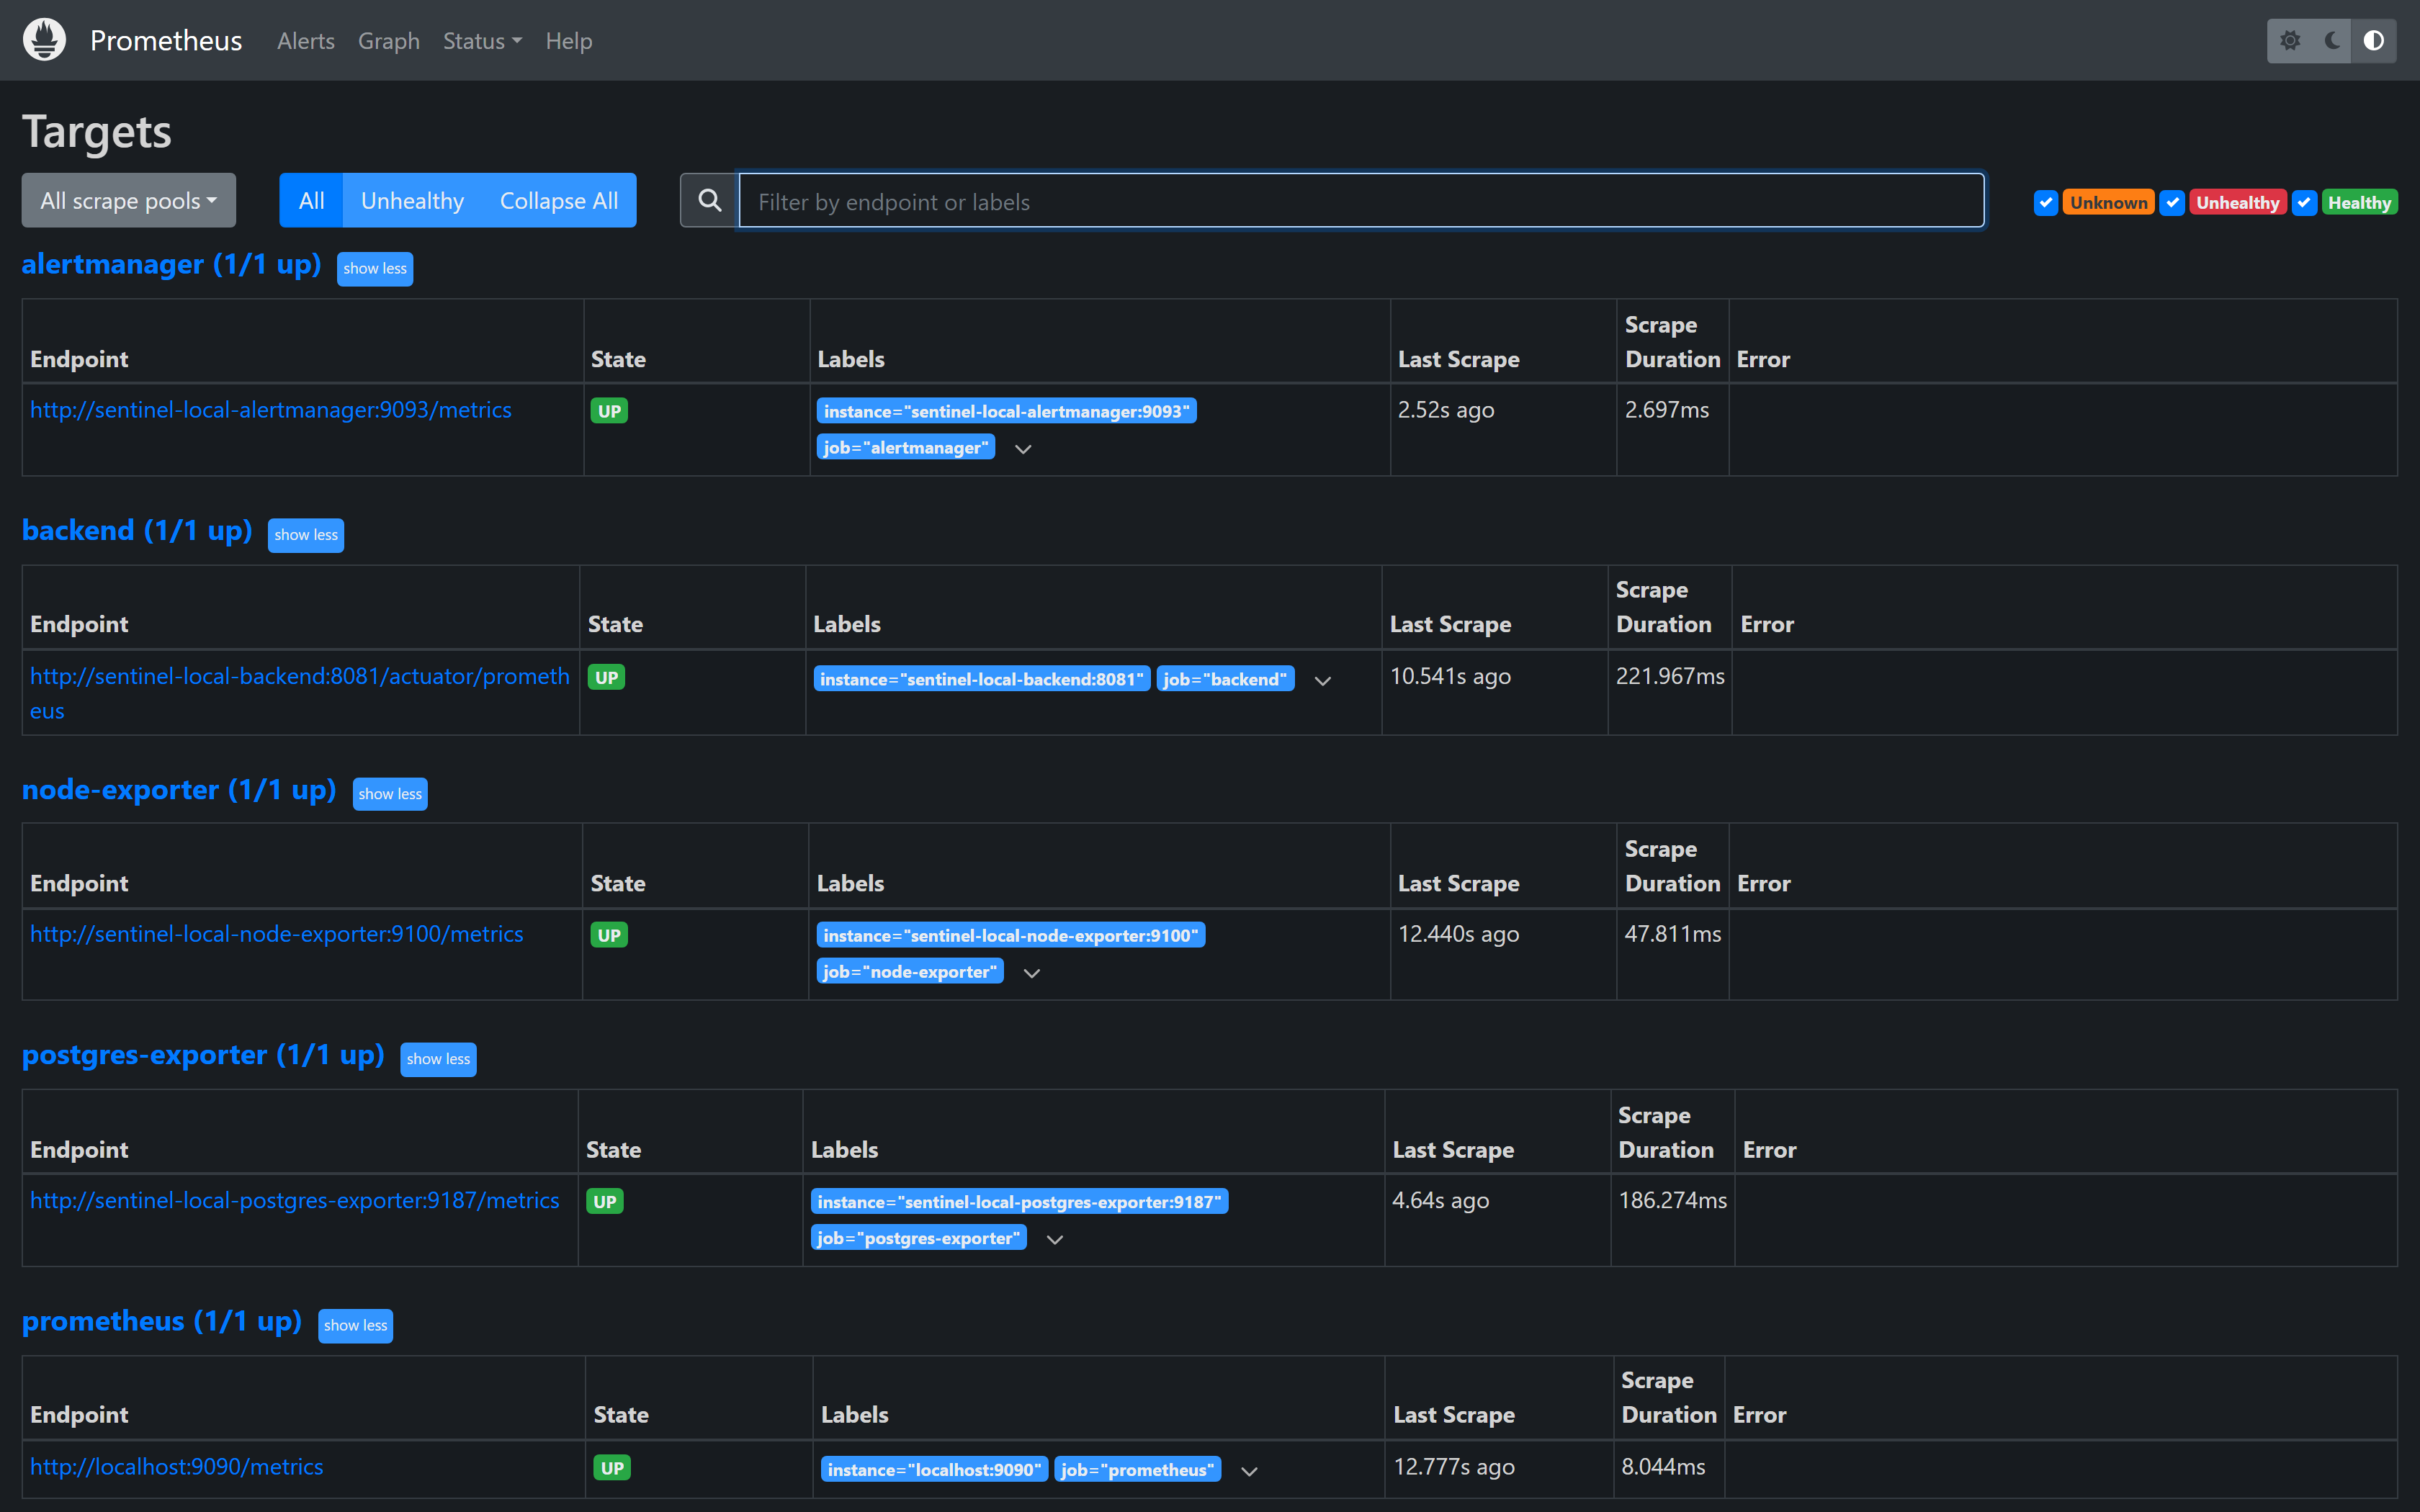
Prometheus -- scrape status for every target: alertmanager, backend, node-exporter, postgres-exporter.
Every component monitors its own health
Application backend, database, host system, alert manager -- each component exposes its own metrics, continuously collected and checked. A target that stops responding is visible immediately, before it affects your users.
- Metric collection per component (backend, database, host, alerts)
- Health status of every target visible at a glance
- The foundation of a real alerting system, not just a status page
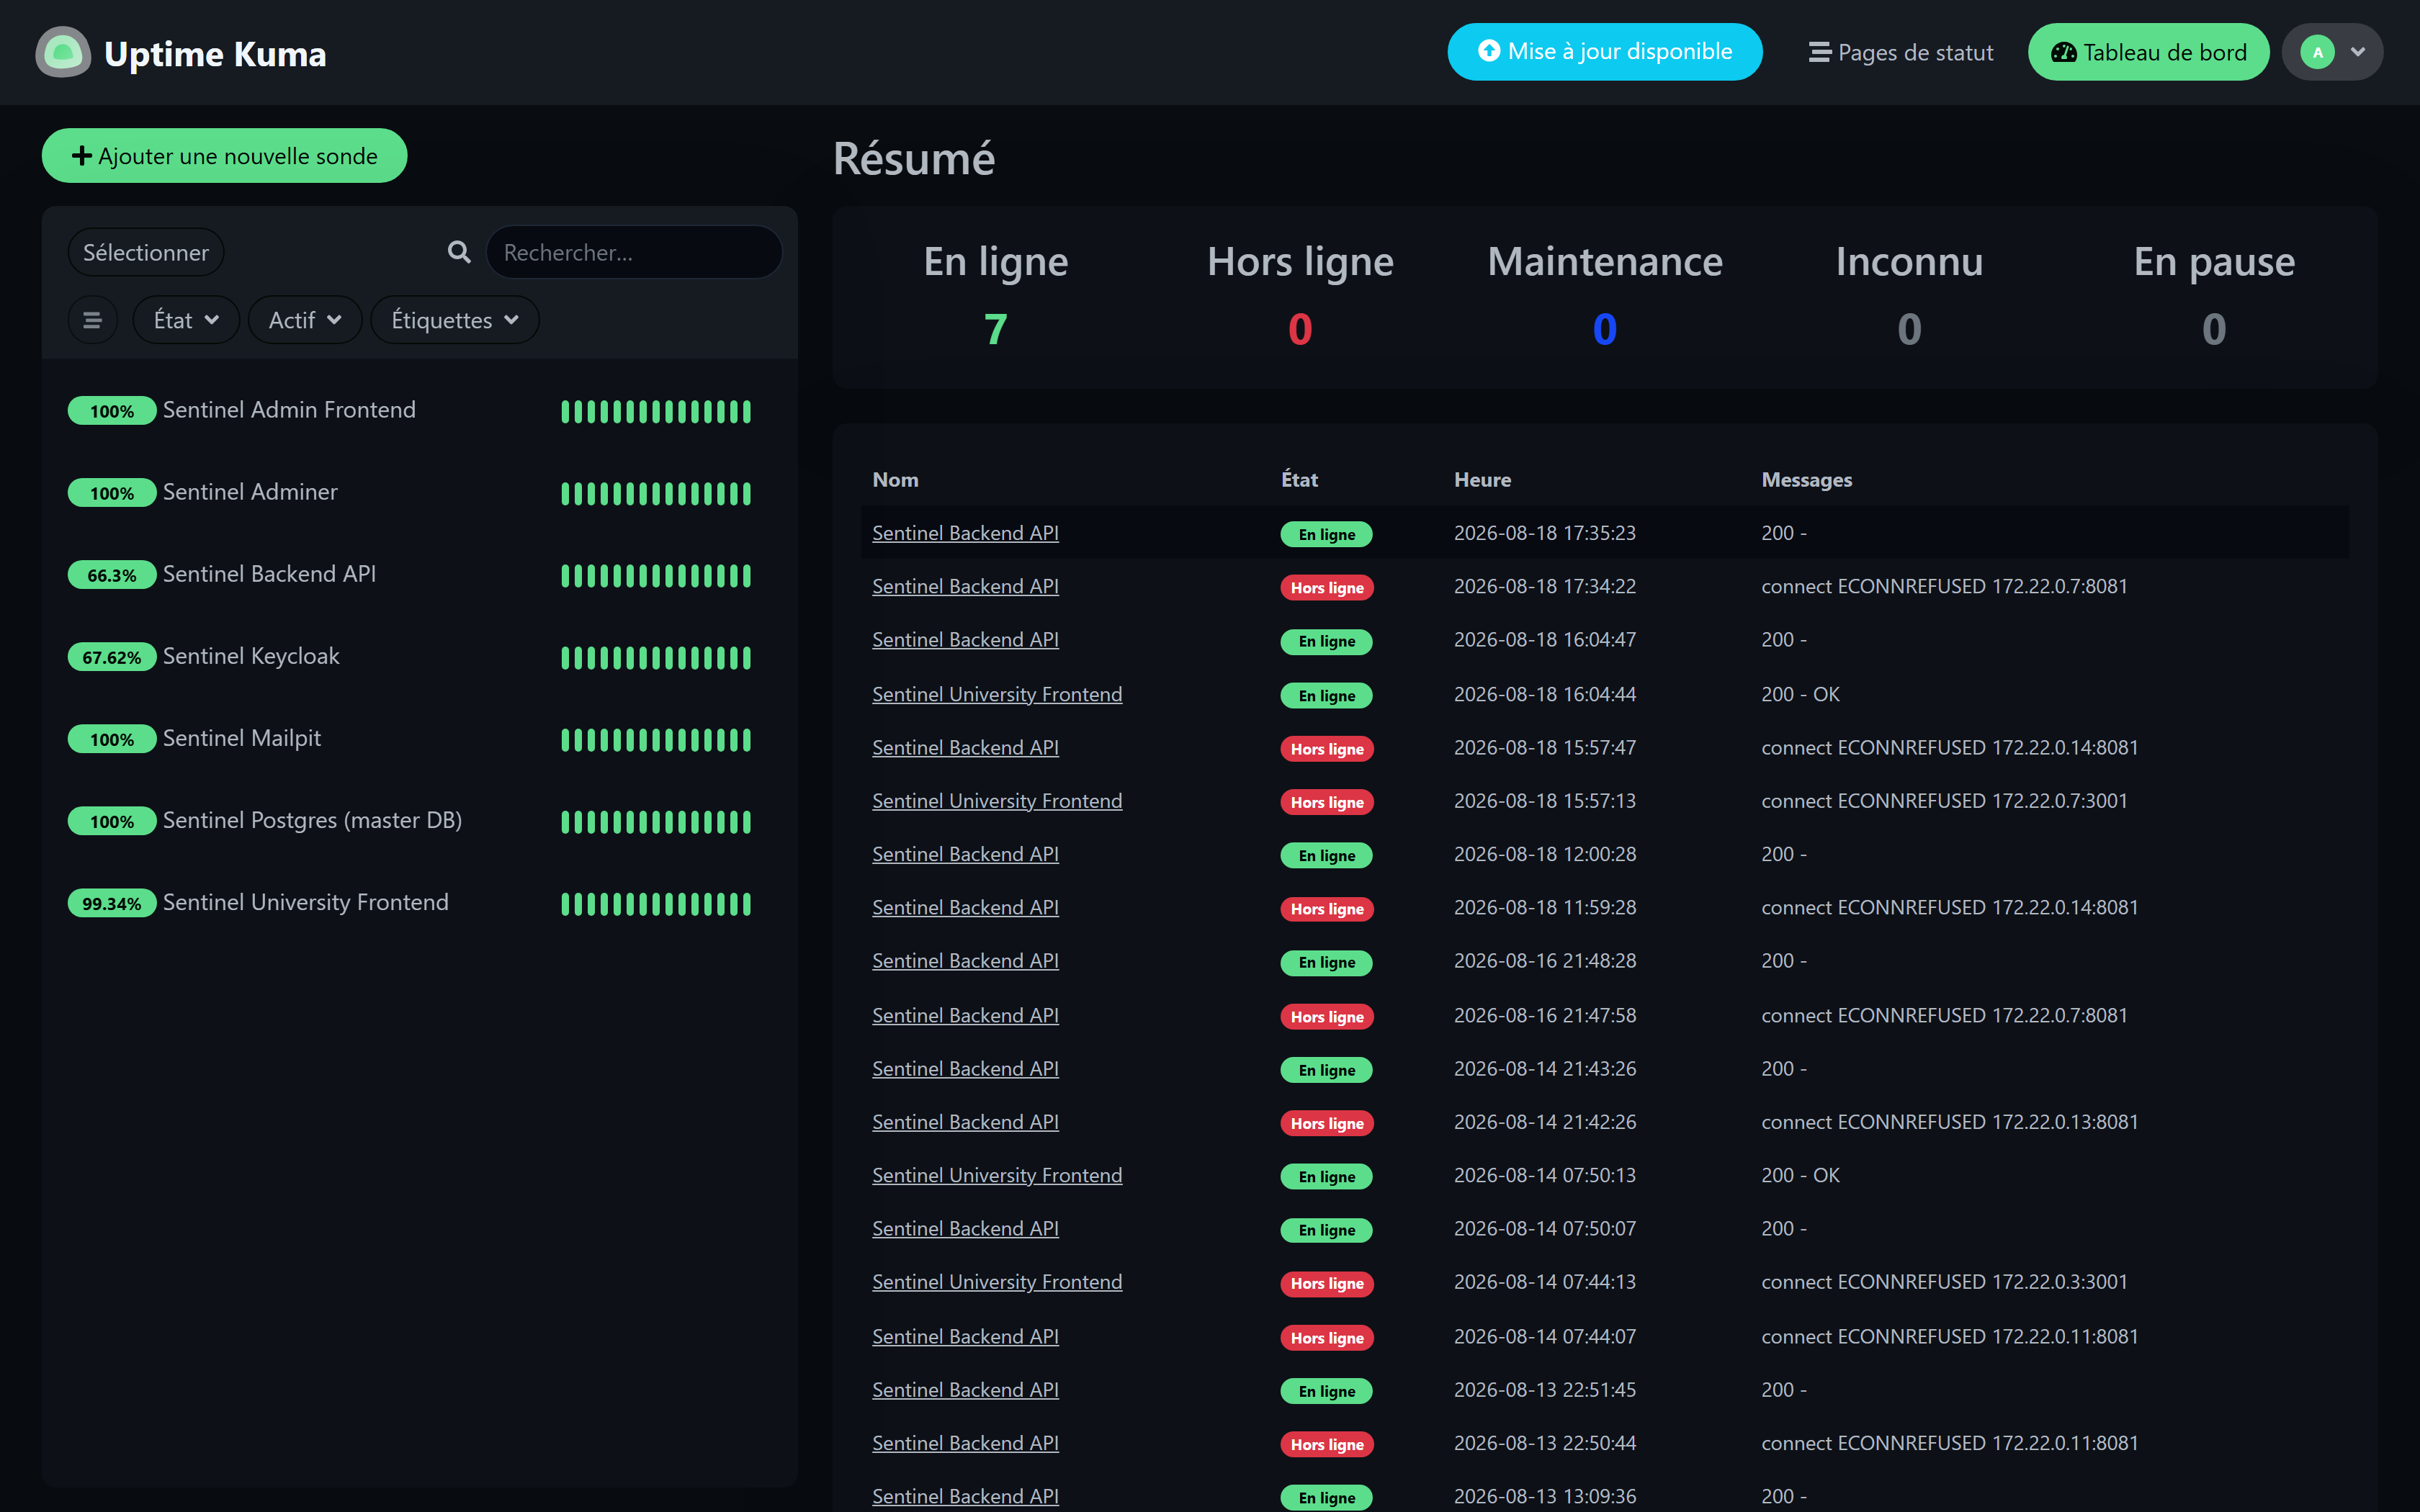
Uptime Kuma -- availability of every service, with the full incident history and its technical cause.
Measured availability, not just claimed
Every service -- backend API, portals, database -- is continuously probed, with a timestamped history of every outage and its technical cause. This is the same measurement that feeds the service-level commitments (SLAs) offered to institutions.
- Continuous probing of every critical service
- Incident history, with the technical cause tracked
- Factual basis for service-level commitments (SLAs)